Initiating Coverage | NBFC
January 1, 2018
Capital First Ltd
BUY
CMP
`693
Target Price
`850
Capital First (CFL) is a non-deposit-taking NBFC primarily focusing on retail
Investment Period
12 Months
lending. Post management buyout
(2012), Mr Vaidynathan, the current
chairman, transformed the company’s focus from wholesale financier to
Stock Info
diversified retail financier. Warburg Pincus in 2012 acquired a majority stake in
Sector
NBFC
the company. Focused approached led to decline in wholesale financing to 7%
Market Cap (` cr)
6,872
now from 90% in FY2010 and stringent underwriting resulting into GNPA of
Beta
1.5
5.3% in FY2010 to 1% in FY2017.
52 Week High / Low
839/512
Strong AUM CAGR of 27.5% over FY2013-17: CFL registered strong AUM
Avg. Daily Volume
33,085
CAGR of 27.5% over FY13-17 post the new strategy adopted by the new
Face Value (`)
10
management. The aggressive focus towards retail loans and decreasing the
BSE Sensex
33,848
wholesale book augured well for CFL. While retail loans grew by 35%, wholesale
Nifty
10,478
loans de-grew by 8.2% over FY2013-17. The share of retail loans in the loan
Reuters Code
CAPF.NS
book went up to 93% (FY2017) from a level of 10% (FY2010). We expect AUM
Bloomberg Code
CAFL.IN
CAGR of 23.3% over FY2017-20.
Favorable Product mix change, lower bank borrowings to be margin accretive:
The management intends to increase the share of higher yielding consumer
Shareholding Pattern (%)
durable (CD)/ two wheeler (2W) financing from 13%/10% presently to 16-17%
Promoters
36.0
each by FY2019. CFL’s high dependence on bank borrowings has reduced to
MF / Banks / Indian Fls
13.1
58% (FY17) v/s. 85% (FY14). However, with better ratings & money market
FII / NRIs / OCBs
24.3
instruments becoming more attractive we expect overall cost of funds to decline,
Indian Public / Others
26.6
aiding NIM expansion by 80bps over FY17-19.
Impressive asset quality: High asset quality has been maintained due to stringent
underwriting process. About 38% of the total applications are disbursed after
Abs.(%)
3m 1yr 3yr
passing through several levels of scrutiny and checks, mainly centered on cash
Sensex
7.4
31.5
53.0
flow evaluation, credit bureau and reference checks. In FY2010, GNPA of CFL
Capital First
(9.6)
33.8
96.1
was 5.3%, which has lowered to 1.6% (Q2FY18) post the new management
taking charges.
3-year price chart
Outlook and valuation: Strong capital adequacy and pick up in retail credit will
900
ensure 24% loan growth over FY2017-20. Favorable loan mix coupled with
800
expansion in NIM would drive 32% earnings CAGR over the same period. Given
700
600
improving return ratios we believe the stock is poised for further re-rating. The
500
stock is trading at 2.2x it FY2020 ABV. We have valued the stock at 2.7x its
400
300
FY2020E ABV and recommend BUY with a target price of `850 over the next 12
200
months.
100
0
Key Financials (Standalone)
Y/E March (` cr)
FY15
FY16
FY17
FY18E FY19E FY20E
NII
501
771
1,228
1,571
2,008
2,536
% chg
53
54
59
28
28
26
Source: Company, Angel Research
Net profit
112
168
240
296
407
550
% chg
89
50
43
23
38
35
NIM (%)
6.1
7.1
8.8
9.2
9.4
9.7
EPS (`)
11.4
17.1
24.5
30.2
41.6
56.3
P/E (x)
60.5
40.3
28.2
22.9
16.6
12.3
P/ABV (x)
4.3
4.1
3.1
2.9
2.5
2.2
Jaikishan Parmar
ROA (%)
1.0
1.2
1.4
1.4
1.5
1.7
022 - 3935 7800 Ext: 6810
ROE (%)
8.1
10.2
12.0
12.2
14.9
17.4
Source :Company, Angel Research; Note: CMP as of December 29, 2017
Please refer to important disclosures at the end of this report
1
Capital First Ltd | Initiating Coverage
Company Background:
Capital First Ltd (CFL) is one of the leading financial institutions in India focused on
providing debt financing to MSMEs and consumers. Capital First Ltd was founded
in 2012 through a management buyout of an existing listed NBFC and equity
backing by a global private equity. With the help of contemporary scoring
solutions and sophisticated technology, the company provides finance to select
segments that are traditionally underserved by existing financial systems due to
small ticket sizes, difficulties in credit evaluation, collection issues, etc. The
company provides financing to salaried and self employed retail customers, which
is a growing category in India.
Exhibit 1: Key milestones
FY10 Wholesale NBFC+ Broking subsidiary
FY11 Launched durable financing business with credit scoring
FY12 Merged subsidiary NBFC with parent and launched two wheeler financing
FY13 Capital First was formed as a result of management buyout of an existing NBFC
FY13 Warburg Pincus acquires 70% stake in the company for `810cr in September 2012
FY14 Closed broking business, acquired HFC license via subsidiary
FY15 Closed gold loan business, AUM crosses `12,000 cr
FY16 AUM crosses `16,000 cr, no of customers financed since inception crosses 2.25 mn
FY17 AUM crosses ` 20,000 cr, no of customers financed since inception crosses 4 mn
Source: Company, Angel Research
Exhibit 2: Types of loans offered by CFL
Products
Ticket Size(` ) Tenor (Months)
Average Loan to Value Ratio
MSME Loans
9,60,000
60
42%
CFL provides long term loans to MSMEs after proper evaluation of
cash flows.
Backed by collateral of residential or commercial property.
Monthly amortizing products with no moratorium.
CFL also provides unsecured short tenure working capital loans to
the MSMEs.
Two Wheeler Loans
44,000
24
70%
CFL provides financing to salaried segment as well as self
employed individuals like small traders, shop keepers for
purchase of new two-wheelers.
Consumer Durables Loans
30,000
8
76%
CFL provides financing to salaried and self-employed customers
for purchasing of LCD/LED panels, Laptops, Air-conditioners
and other such white good products. They are also availed by
small entrepreneurs for official purposes.
Change in ownership & management brings new life to the company: The
company was first listed on Stock Exchanges in January 2008. Between 2010 to
2012, Mr Vaidyanathan acquired a stake in the company, changed the business
model to retail, and executed a Management Buyout of the company with equity
backing from Warburg Pincus for `810cr and changed the name to Capital First.
Post 2012, CFL raised `178cr from Warburb Pincus and HDFC Standard Life. AS
CFL was growing at 25%+ CAGR it raised `300cr through QIP in FY2015
subscribed by Goldman Sachs. In Q4FY2017, it raised `340cr through preferential
allotment to GIC, Singapore.
January 01, 2018
2
Capital First Ltd | Initiating Coverage
Transition from a wholesale financer to a retail financer: The new management led
by Mr Vaidyanathan focused more on the granular retail loan category, and thus
successfully transitioned as a retail lender. The share of wholesale finance has
been brought down to 7% by FY2017 from 90% in FY2010. CFL still has a high
dependency on the Loan against Property, 42% of the overall loan book, which it
intends to bring down to 33% by FY2019. Simultaneously, the company intends to
increase CD/2W financing from 13%/10% presently to 16-17% each by FY19. The
company also has an unsecured SME loan book accounting for ~18% of the total
loans.
Exhibit 3: Loan book driven by new segments like 2W/CD
120
100
7
16
14
19
80
10
7
9
6
10
13
60
4
8
5
13
18
40
55
56
48
20
42
-
FY14
FY15
FY16
FY17
LAP SME Consumer 2W Home Loan Other WholeSale
Source: Company, Angel Research
Strong AUM CAGR of 27.5% over FY2013-17, expect 23.3% CAGR over FY2017-
20: CFL registered strong AUM CAGR of 27.5% over FY13-17 post the new
strategy adopted by the new management. The aggressive focus towards retail
loans and decreasing the wholesale book augured well for CFL. While retail loans
grew by 35%, wholesale loans de-grew by 8.2% over FY2013-17. The share of
retail loans in the loan book went up to 93% (FY2017) from a level of 10%
(FY2010). We expect AUM CAGR of 23.3% over FY2017-20.
Exhibit 4: AUM Growth (%)
40,000
40%
37%
35,000
35%
29%
30,000
30%
25%
24%
23%
25,000
21%
22%
25%
21%
20,000
20%
15,000
15%
10,000
10%
5 ,000
5%
-
0%
FY13
FY14
FY15
FY16
FY17
FY18E FY19E FY20E
AUM (` Cr)
% Growth
Source: Company, Angel Research
January 01, 2018
3
Capital First Ltd | Initiating Coverage
Increasing number of MSME/ SME coming under the formal sector, opens newer
opportunities for the company: The Indian economy is going through a paradigm
shift, backed by new initiatives by the government. Further, measures like GST,
Aadhar card based e-KYC, etc. will have far reaching impact and enable
augmenting financial inclusion. Hence, NBFCs like CFL will be able to tap the vast
underserved individuals whose credit needs have been growing with the change in
aspirations and income levels. CFL is well placed to take advantage of these
opportunities going ahead.
Housing Finance, still small but has huge potential for CFL: in order to diversify the
loan book further, the management ventured into retail home loans in 2015, via
its wholly owned subsidiary, Capital First Home Finance Ltd. With an average ticket
size of ~`15 lakhs, the loans are targeted primarily to the self employed
professionals in the affordable housing segment. The opportunity of lending
towards self employed segment remains huge with very few players operating in
the segment. Within a short span of time the AUM in the housing finance has
reached a level of ~`800cr (~`600cr at the end of FY17) and we expect the
growth rate to be 40-50% over the next few years.
Despite higher share of LAP/ SME lending, the NPAs are largely under control:
The GNPA of the company was as high as 5.3% in FY2010, which was brought
down to 1% (FY2017). The CFL has started complying with RBI regulations
recognizing NPAs on 90 days overdue basis (90 DPD), at par with banks now.
Earlier it had migrated to 120 DPD in Q1FY17. Though the company migrated to
90 DPD it already had done adequate provisions.
Exhibit 5: Comparative NPA trend- On 90 DPD basis
2.00
1.74
1.71
1.72
1.80
1.65
1.63
1.59
1.52
1.60
1.40
1.21
1.13
1.20
1.04
0.97
1.00
1.00
1.00
1.00
0.80
0.60
0.40
0.20
-
Q4FY16
Q1FY17
Q2FY17
Q3FY17
Q4FY17
Q1FY18
Q2FY18
GNPA (%) NPA (%)
Source: Company, Angel Research
January 01, 2018
4
Capital First Ltd | Initiating Coverage
With 90 days NPA recognition norm, the credit cost is more comparable with
peers: The credit cost of CFL has gone up in FY17 partly due to demonetization
and impact of slowdown in the economy. Also, the nature of consumer lending in
retail space will have higher credit cost. However, we believe the company is at the
peak of its credit cost cycle and there could be a moderation in the same going
ahead. We have factored in 280bps credit cost in FY2018E/FY2019E/FY2020E
each.
Exhibit 6: Credit cost trend (%)
3.0
2.8
2.8
2.8
2.8
2.5
2.0
1.9
1.5
1.0
1.0
0.6
0.5
-
FY14
FY15
FY16
FY17
FY18E
FY19E
FY20E
Credit Cost (%)
Source: Company, Angel Research
Reducing dependence on bank borrowings, to help lower cost of funds:
Historically, CFL had high dependency on bank borrowings for its business. The
share of bank borrowings in its sources of funds was as high as 85% in FY2014,
which has gradually been brought down to 58% by FY2017. The management
expects the share of bank borrowings to reduce to ~40% of total by FY2019. With
overall softening of interest rates and G-Sec yields, the cost of borrowings via
money market instruments have become attractive, and hence, the share of
borrowings from the same source has gone up to 42% from 15% (FY15). The
NBFC has a AA+ rating for it borrowings from CARE and based on the current
spread between AA+ and 10 Yr G-Sec yield, we believe there is further scope for
re-pricing its high cost bank borrowings as well as re-pricing of old NCDs with
fresh NCDs at a much attractive rate.
Exhibit 7: Changing funding profile
120%
100%
15%
15%
25%
80%
42%
60%
40%
85%
85%
75%
58%
20%
0%
FY14
FY15
FY16
FY17
Bank Borrowings
Others
Source: Company, Angel Research
January 01, 2018
5
Capital First Ltd | Initiating Coverage
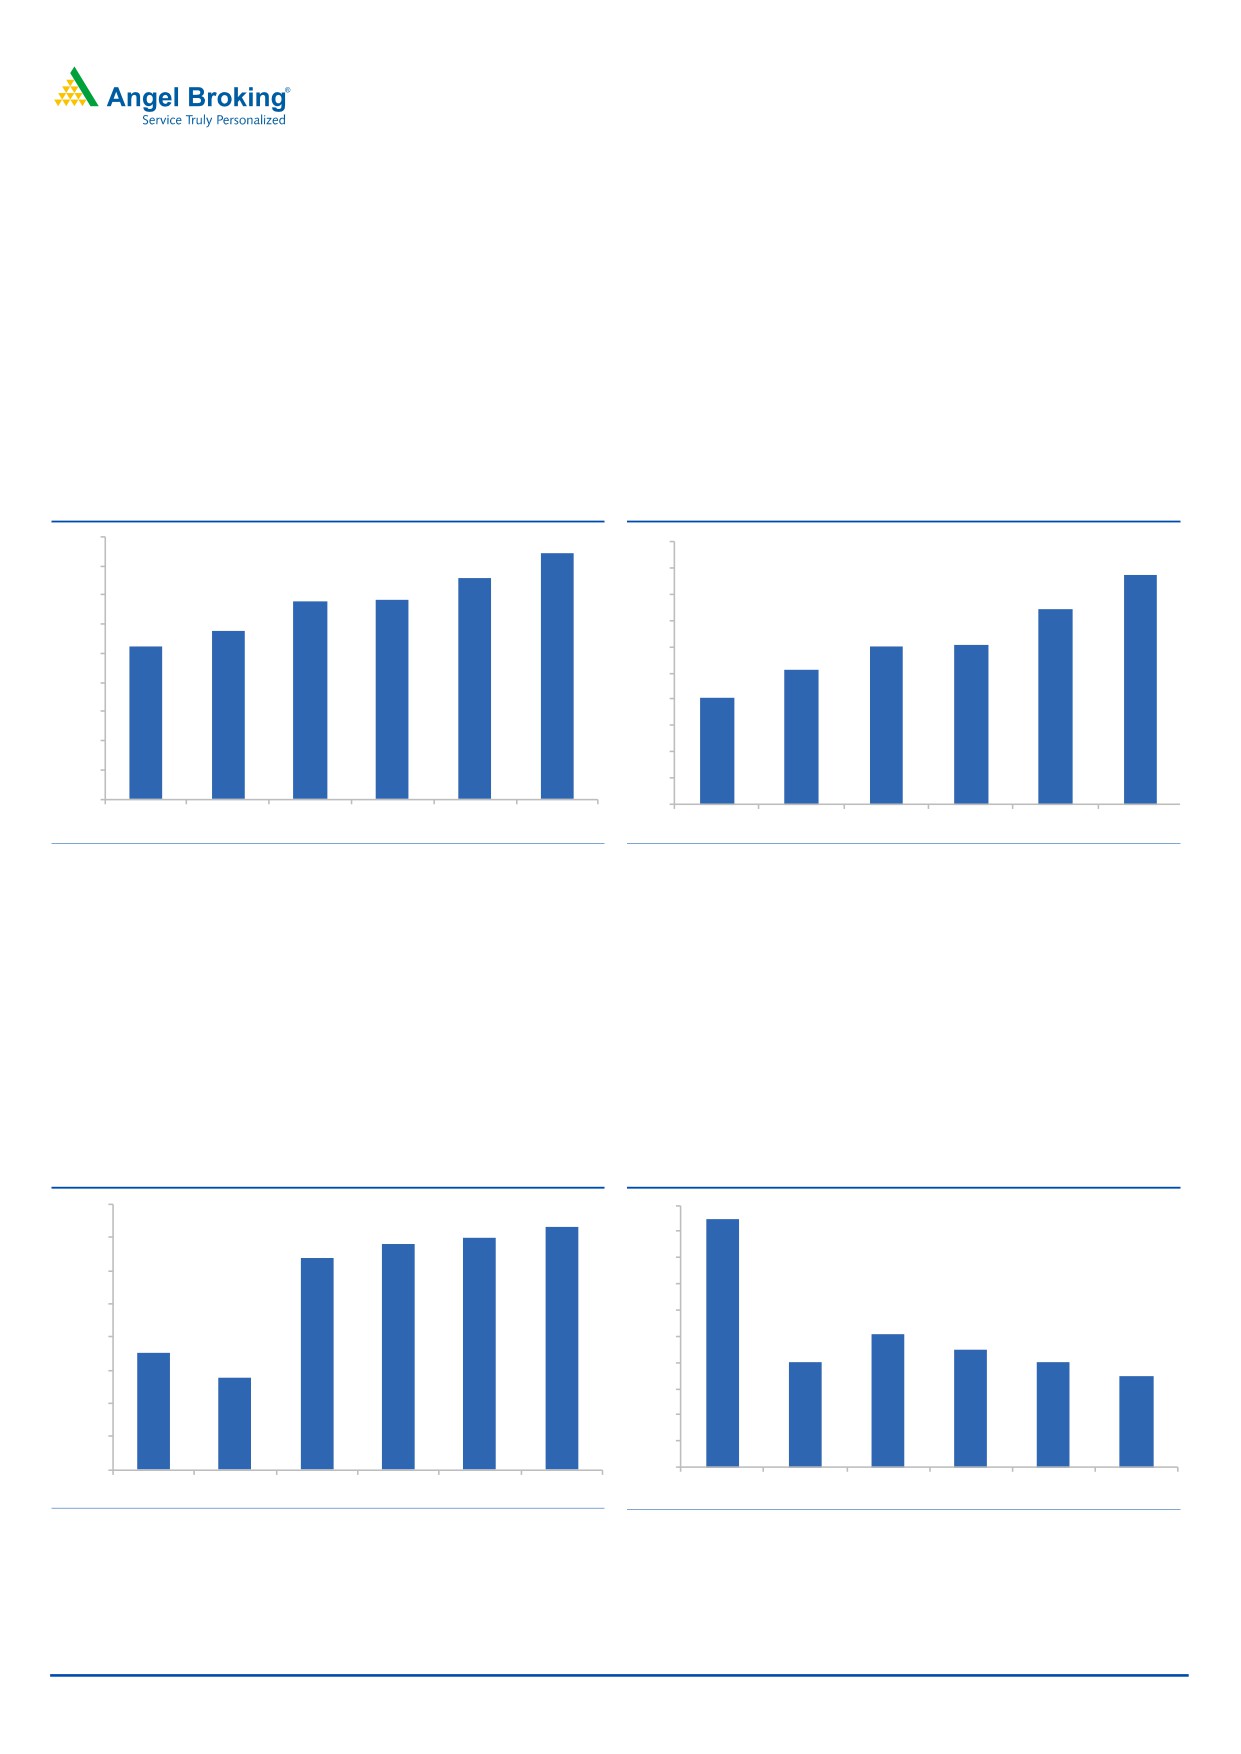
Shift towards higher yielding assets and lower Opex cost on incremental business
in 2W/CD to result in ROE improvement: CFL has successfully transitioned from a
wholesale financer to a retail financer over the last five years. However, within the
retail space higher dependency on LAP and front loading of operating cost, both in
terms of technology and manpower had impacted the cost structure. With
maturing business in the consumer durable financing and two wheeler financing
segments, Opex cost would reduce for incremental business in 2W/CD. In the
absence of major equity dilution in the near term and moderating Opex cost, we
expect ROE to improve from 11.9% in FY2017 to ~17% by FY2020.
Exhibit 8: ROA (%)
Exhibit 9: ROE (%)
1.8
1.7
20
1.5
17
1.6
18
1.4
1.4
1.4
16
15
1.2
1.2
14
1.0
12
12
12
1.0
10
10
0.8
8
8
0.6
6
0.4
4
0.2
2
-
-
FY15
FY16
FY17
FY18E
FY19E
FY20E
FY15
FY16
FY17
FY18E
FY19E
FY20E
Source: Company, Angel Research
Source: Company, Angel Research
Product mix revival, lower bank borrowings to be margin accretive: CFL has
gradually reduced its share of wholesale book and is focusing more on the retail
lending. Within the retail space, the company is still highly dependent on the
mortgage based SME lending (LAP). However, as a strategy, it intends to further
reduce its dependence on the LAP and is now focusing more on the granular retail
loans like Consumer durables and two wheelers, which also generates higher
yield, and hence, we expect yield on advances to improve further.
Exhibit 10: Yield (%)
Exhibit 11: Cost of funds (%)
18.0%
9.4%
9.3%
17.7%
17.5%
17.4%
9.3%
17.5%
17.2%
9.2%
17.0%
9.1%
16.5%
9.0%
8.9%
16.0%
15.8%
8.9%
8.9%
8.8%
8.8%
15.4%
8.8%
8.8%
15.5%
8.7%
15.0%
8.6%
14.5%
8.5%
14.0%
8.4%
FY15
FY16
FY17
FY18E
FY19E
FY20E
FY15
FY16
FY17
FY18E
FY19E
FY20E
Source: Company, Angel Research
Source: Company, Angel Research
January 01, 2018
6
Capital First Ltd | Initiating Coverage
Historically, CFL had high dependency on bank borrowings for its business.
However, with better ratings & money market instruments becoming more
attractive, it has started raising funds via NCDs. This, together with lower cost of
funds, due to reduction in MCLR based borrowings will help in NIM improvement.
We have factored in an 80bps improvement in NIM over FY2017-20.
Exhibit 12: NIM to increase 80bps with product mix shift
12.0
9.7
10.0
9.2
9.4
8.8
8.0
7.1
6.1
6.0
5.0
4.0
2.0
-
FY14
FY15
FY16
FY17
FY18E
FY19E
FY20E
NIM (%)
Source: Company, Angel Research
NII growth will be in sync with AUM growth: We expect NII to grow at healthy
CAGR of 27.3% over FY2017-20. NII growth would be backed by (a) AUM growth
of 23.3%, (2) change in product mix from low yielding loan book to high yielding
loan book (2W/CD), (3) Reduction in cost of funds due to higher borrowing from
market instrument and cut in MCLR rates to help in refinancing existing high cost
borrowing at lower cost.
Exhibit 13: NII Growth has been in sync with AUM growth
3,000
26%
70%
61%
61%
2,500
60%
27%
50%
2,000
31%
40%
1,500
30%
1,000
20%
500
10%
-
0%
FY15
FY16
FY17
FY18E
FY19E
FY20E
NII
% Growth YoY
Source: Company, Angel Research
January 01, 2018
7
Capital First Ltd | Initiating Coverage
Pre-provisioning profit (PPP) to get a boost from fee income: The granular asset
base of the company has helped in strong growth in fee income as well, and we
expect fee income to contribute meaningfully to the pre-provisioning profit. CFL
has incurred capex to develop 2W/CD financing business since 2011; hence going
forward C/I ratio would witness a declining trend.
Exhibit 14: PPP growth trend
1,800
160%
136%
1,600
140%
1,400
120%
1,200
100%
82%
1,000
66%
80%
800
60%
600
30%
28%
400
23%
40%
200
20%
-
0%
FY15
FY16
FY17
FY18E
FY19E
FY20E
PPP (`cr)
% Growth
Source: Company, Angel Research
PAT growth will outpace NII growth, backed by moderating cost: We expect the
PAT growth of the company to outpace its loan and NII growth, largely backed by
lower cost structure and stable credit cost. With higher adoption of technology and
Algo based lead generation, the company intends to reduce its cost structure, and
this should aid the bottom-line growth. The cost income ratio of the company has
already come down to 50.6% in FY2017 from a high of 59% in FY2015. However,
it still remains high and we believe there is scope for the same to come down
further.
Exhibit 15: PAT growth trend
600
89%
100%
500
80%
400
50%
60%
43%
38%
35%
300
40%
23%
200
20%
-7%
100
0%
-
-20%
FY14
FY15
FY16
FY17
FY18E
FY19E
FY20E
PAT (`Cr)
% Growth
Source: Company, Angel Research
January 01, 2018
8
Capital First Ltd | Initiating Coverage
Outlook and valuation
Strong capital adequacy and pick up in retail credit will ensure 24% loan growth
over FY2017-20. Favorable loan mix coupled with expansion in NIM would drive
32% earnings CAGR over the same period. Given improving return ratios we
believe the stock is poised for further re-rating. The stock is trading at 2.2x it
FY2020 ABV. We have valued the stock at 2.7x its FY2020E ABV and recommend
BUY with a target price of `850 over the next 12 months.
Exhibit 16: Comparative valuations & return ratios
P/BV (x)
ROE%
ROA%
FY17
FY18E
FY19E
FY17
FY18E
FY19E
FY17
FY18E
FY19E
Capital First
3.0
2.7
2.4
12.0
12.2
14.9
1.4
1.4
1.5
Bajaj Fin
9.5
6.1
5.1
21.6
20.5
20.2
3.3
3.5
3.6
L&T Fin
3.6
3.2
2.7
12.1
14.9
16.9
1.5
1.7
1.9
M&M Fin
3.7
3.2
2.8
7.6
13.5
15.5
1.1
1.8
2.2
Chola
4.6
3.9
3.3
18.1
19.3
19.9
2.5
2.6
2.7
Shriram City
2.6
2.3
2.1
11.8
15.1
16.4
2.3
2.9
3.0
Magma
1.8
4.7
4.2
0.9
9.3
12.3
0.1
1.3
1.8
STFC
2.9
0.9
0.8
11.7
13.9
16.5
1.7
2.2
2.6
Sundaram Fin
4.2
1.3
1.1
15.2
16.1
16.1
2.3
2.8
2.9
Source: Company, Angel Research, based on closing price of 26th Dec
2017, other NBFC estimates taken from Bloomberg,
Exhibit 17: One Year Forward P/BV
1200.00
1000.00
800.00
600.00
400.00
200.00
0.00
CAFL
0.8 X
1.3 X
1.8 X
2.3 X
3.0 X
Source: Company, Angel Research
January 01, 2018
9
Capital First Ltd | Initiating Coverage
Income statement
Y/E March (` cr)
FY16
FY17
FY18E
FY19E
FY20E
NII
771
1,228
1,571
2,008
2,536
- YoY Growth (%)
54
59
28
28
26
Other Income
221
412
424
525
643
- YoY Growth (%)
45
86
3
24
22
Operating Income
992
1,640
1,995
2,533
3,179
- YoY Growth (%)
52
65
22
27
26
Operating Expenses
503
830
996
1,234
1,511
- YoY Growth (%)
30
65
20
24
22
Pre - Provision Profit
489
810
999
1,298
1,667
- YoY Growth (%)
82
66
23
30
28
Prov. & Cont.
236
453
558
691
846
- YoY Growth (%)
125
92
23
24
22
Profit Before Tax
252
357
441
608
821
- YoY Growth (%)
55
42
23
38
35
Prov. for Taxation
85
117
146
200
271
- as a % of PBT
34
33
33
33
33
PAT
168
240
296
407
550
- YoY Growth (%)
50
43
23
38
35
Balance Sheet
Y/E March (` cr)
FY16
FY17
FY18E
FY19E
FY20E
Share Capital
91
97
97
97
97
Reserve & Surplus
1,612
2,206
2,465
2,820
3,301
Net Worth
1,703
2,304
2,562
2,918
3,398
Borrowings
11,955
14,108
17,635
21,691
26,246
- Growth (%)
42
18
25
23
21
Other Liabilities
65
80
88
109
133
Total Provisions
113
119
142
175
214
Current Liabilities
689
1,044
1,270
1,886
2,645
Total Liabilities
14,525
17,655
21,697
26,779
32,637
Total Loans & Advances
12,656
15,136
19,071
23,648
28,851
- Growth (%)
40
20
26
24
22
Cash and Cash equivalents
1,113
1,594
1,648
2,042
2,489
Investments
184
259
269
334
407
Fixed Assets
29
65
57
71
86
Other CA
333
392
441
546
666
Other Non Current Assets
210
211
210
138
138
Total Assets
14,525
17,655
21,697
26,779
32,637
January 01, 2018
10
Capital First Ltd | Initiating Coverage
Exhibit 18: Key Ratio
Y/E March
FY16
FY17
FY18E
FY19E
FY20E
Profitability ratios (%)
NIMs
7.1
8.8
9.2
9.4
9.7
RoA
1.2
1.4
1.4
1.5
1.7
RoE
10.2
12.0
12.2
14.9
17.4
Cost/Income
50.7
50.6
49.9
48.7
47.5
Asset Quality (%)
Gross NPAs %
1.1
1.7
1.8
1.9
1.9
Net NPAs %
0.6
1.0
1.1
1.1
1.2
Credit Cost
1.9
2.8
2.8
2.8
2.8
PCR %
48.6
39.4
38.9
42.1
39.5
Per Share Data (`)
EPS
17
25
30
42
56
BVPS
174
236
262
298
347
Adj BV
167
220
240
272
313
DPS
2.2
2.6
3.2
4.4
5.9
Valuation Ratios
PER (x)
40.3
28.2
22.9
16.6
12.3
P/BVPS (x)
4.0
2.9
2.6
2.3
2.0
P/ABVPS (x)
4.1
3.1
2.9
2.5
2.2
Dividend Yield (%)
0.3
0.4
0.5
0.6
0.9
DuPont Analysis
Interest Income
11.5
13.5
13.7
14.0
14.2
Interest Expenses
6.2
6.6
6.5
6.5
6.4
NII
5.3
7.0
7.2
7.5
7.8
Provision
1.6
2.6
2.6
2.6
2.6
Fees & Other
1.5
2.3
2.0
2.0
2.0
Total Income Adj Prov
5.2
6.7
6.6
6.9
7.1
Opex
3.5
4.7
4.6
4.6
4.6
PBT
1.7
2.0
2.0
2.3
2.5
Tax
0.6
0.7
0.7
0.7
0.8
ROA
1.2
1.4
1.4
1.5
1.7
Leverage
8.9
8.8
8.9
9.8
10.3
ROAN
10.2
12.0
12.2
14.9
17.4
Source: Note - Valuation done on closing price of 28/12/2017
January 01, 2018
11
Capital First Ltd | Initiating Coverage
Research Team Tel: 022 - 39357800
DISCLAIMER
Angel Broking Private Limited (hereinafter referred to as “Angel”) is a registered Member of National Stock Exchange of India Limited,
Bombay Stock Exchange Limited and Metropolitan Stock Exchange Limited. It is also registered as a Depository Participant with CDSL
and Portfolio Manager with SEBI. It also has registration with AMFI as a Mutual Fund Distributor. Angel Broking Private Limited is a
registered entity with SEBI for Research Analyst in terms of SEBI (Research Analyst) Regulations, 2014 vide registration number
INH000000164. Angel or its associates has not been debarred/ suspended by SEBI or any other regulatory authority for accessing
/dealing in securities Market. Angel or its associates/analyst has not received any compensation / managed or co-managed public
offering of securities of the company covered by Analyst during the past twelve months.
This document is solely for the personal information of the recipient, and must not be singularly used as the basis of any investment
decision. Nothing in this document should be construed as investment or financial advice. Each recipient of this document should
make such investigations as they deem necessary to arrive at an independent evaluation of an investment in the securities of the
companies referred to in this document (including the merits and risks involved), and should consult their own advisors to determine
the merits and risks of such an investment.
Reports based on technical and derivative analysis center on studying charts of a stock's price movement, outstanding positions and
trading volume, as opposed to focusing on a company's fundamentals and, as such, may not match with a report on a company's
fundamentals. Investors are advised to refer the Fundamental and Technical Research Reports available on our website to evaluate the
contrary view, if any.
The information in this document has been printed on the basis of publicly available information, internal data and other reliable
sources believed to be true, but we do not represent that it is accurate or complete and it should not be relied on as such, as this
document is for general guidance only. Angel Broking Pvt. Limited or any of its affiliates/ group companies shall not be in any way
responsible for any loss or damage that may arise to any person from any inadvertent error in the information contained in this report.
Angel Broking Pvt. Limited has not independently verified all the information contained within this document. Accordingly, we cannot
testify, nor make any representation or warranty, express or implied, to the accuracy, contents or data contained within this document.
While Angel Broking Pvt. Limited endeavors to update on a reasonable basis the information discussed in this material, there may be
regulatory, compliance, or other reasons that prevent us from doing so.
This document is being supplied to you solely for your information, and its contents, information or data may not be reproduced,
redistributed or passed on, directly or indirectly.
Neither Angel Broking Pvt. Limited, nor its directors, employees or affiliates shall be liable for any loss or damage that may arise from
or in connection with the use of this information.
Disclosure of Interest Statement
Capital First Ltd
1. Financial interest of research analyst or Angel or his Associate or his relative
No
2. Ownership of 1% or more of the stock by research analyst or Angel or associates or relatives
No
3. Served as an officer, director or employee of the company covered under Research
No
4. Broking relationship with company covered under Research
No
Ratings (Based on expected returns
Buy (> 15%)
Accumulate (5% to 15%)
Neutral (-5 to 5%)
over 12 months investment period):
Reduce (-5% to -15%)
Sell (< -15)